High-performance Use Cases of LPVR & Varjo Headsets
Components of a VR/AR Operating System
Augmented and virtual reality technology helps boost worker productivity in various fields such as automotive, aerospace, industrial production, and more. Whereas the context of these applications is usually fairly specific, some aspects are common to many of these use cases. In this article, we will specifically explore the topic of pose tracking of Varjo head mounted displays (HMDs) based on LP-RESEARCH’s LPVR operating system. We will further on show two customer use cases that utilize LPVR in different ways.
In a typical VR/AR setup, you find three main subsystems as shown in the illustration below:

With our LPVR operating system, we connect these three building blocks of an VR/AR system and make them communicate seamlessly with each other while providing a simple, unified interface to the user. Depending on the specific use case, users might select different types of hardware to build their VR/AR setup. Therefore LPVR offers a wide range of interface options to adapt to systems from various manufacturers.
LPVR Flavors
LPVR operates in different flavors, we can group end applications into two categories:
- LPVR-CAD – Static AR/VR setups, where multiple users operate and collaborate in one or more joint tracking volumes. These tracking volumes can be situated in different locations.
- LPVR-DUO – AR/VR systems that are located in a vehicle or on a motion platform: such systems have special requirements, especially on the tracking side. If, for example, you would want to track a headset inside a car, displaying a virtual cockpit anchored to the car frame, and a virtual outside world fixed to a global coordinate system, means of locating the car in the world and referencing the HMD locally in the car frame are required.
In the following paragraphs, we will introduce two customer use cases that cover these two basic scenarios.
Large-scale Industrial Design at Hyundai

– Varjo XR-3 at Hyundai Design Center with optical markers attached. Image credit: Hyundai
For the Korean automotive company Hyundai Motor Company, we created a large, location-based virtual reality installation at their research and development center in Namyang, Korea. The system is used to showcase, amend and modify prototype and production-ready automobile designs.
This application uses optical outside-in tracking and LP-RESEARCH’s LPVR-CAD solution to track up to 20 users wearing head-mounted displays. While LPVR allows a mix of different headset types to operate in the same tracking volume, the Varjo XR-3 gives the most outstanding performance to inspect objects in high resolution and great detail. Additionally to an HMD, users carry hand controllers for a total of more than 40 tracked objects in a space close to 400 sqm.
")
 (1)")
– Hyundai’s collaborative virtual reality design experience. Image credit: Hyundai
Responsiveness is achieved by using LPVR-CAD to combine data from the inertial measurement unit built into the headsets and information from the optical tracking system. The optical system uses 36 infrared cameras to track the 160 markers attached to the HMDs and hand controllers. Perfectly smooth and uninterrupted position and orientation data of each user’s HMD is achieved by using LP-RESEARCH’s sensor fusion algorithms.
Depending on the type of headset, users either wear a backpack PC, connect to a host wirelessly or use an extra-long cable to connect directly to a rendering PC outside the tracking volume.
“Currently, we are actively utilizing VR from the initial development stage to the point of development. In the future, we plan to increase accessibility and usability by simplifying equipment using wireless HMDs. For this, improving the speed and stability of wireless internet is essential, which we plan to address by introducing 5G. In addition, LP RESEARCH’s technology is essential for multi-user location sharing within a virtual space.” – SungMook Kang, Visualization Specialist, Hyundai Motor Company
Next-level Automotive Entertainment with CUPRA
Imagine.. playing Mario cart, your hands are gripping the wheel, and you are in Neo Tokyo, on a race track. Futuristic buildings keep flying by while you race ahead, drifting into long turns and leaving your competitors behind you.
Now imagine you are no longer in your living room, you are sitting in an actual race car, buzzing around in an empty parking lot. Instead of looking through the windshield with your own eyes, you are wearing a Varjo XR-3 HMD. What you see outside the car is a virtual world, it’s Neo Tokyo.

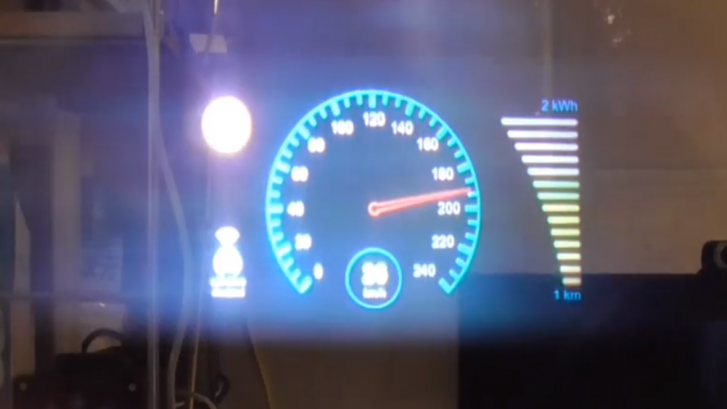
– The view through the Varjo XR-3 headset. Image credit: CUPRA
As the car moves on the parking lot, you move inside the virtual world. When you move your head inside the car’s cockpit, the motions of your head are accurately tracked.

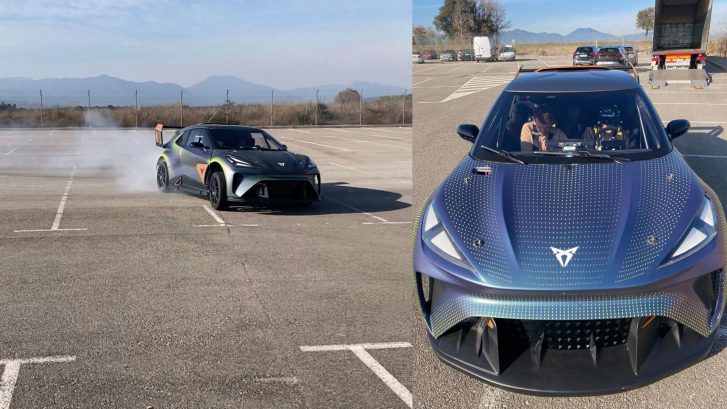
– Varjo XR-3 inside the cabin of the Urban Rebel. Image credit: Fonk Magazine

– Cupra’s Urban Rebel drifting on the test course
Together with the Norwegian company Breach VR, we have implemented this experience for the automotive company CUPRA. CUPRA is relentlessly pushing the technology of their vehicles into the future, striving to provide a novel driving experience to their customers.
Tracking of the vehicle and the Varjo XR-3 inside the vehicle is achieved with LP-RESEARCH’s automotive tracking systems LPVR-DUO. As the headset’s gyroscope sensors record the superimposed motion data of the car and the user inside the car, a specialized sensing system, and the algorithm are required to separate the two.
The result of this cascade of exceptional technology is a compellingly immersive driving experience of the future. The combination of an outstanding visualization device like the Varjo XR-3, LPVR state-of-the-art tracking, BreachVR’s 3D software and design and, last but not least, the incredible CUPRA race cars make for an exciting ride that you’ll greatly enjoy and never forget. Come and join the ride!
Check this blog blog post in the Varjo Insider Blog.
Check out our Instagram for further use cases with Varjo’s HMDs: @lpresearchinc