LPVR-AIR Demo at SIGGRAPH 2023
Ready – Steady – Go!
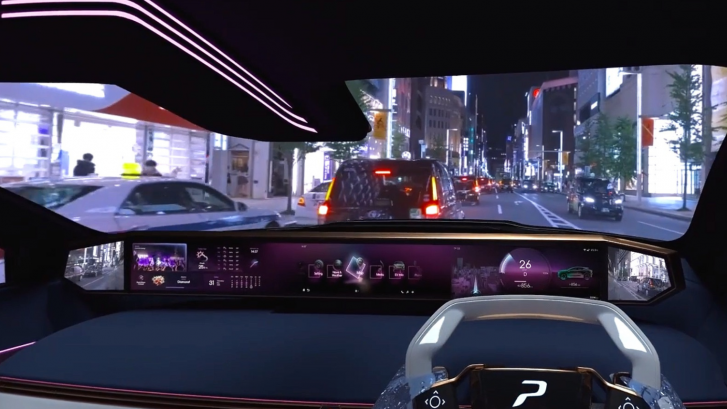
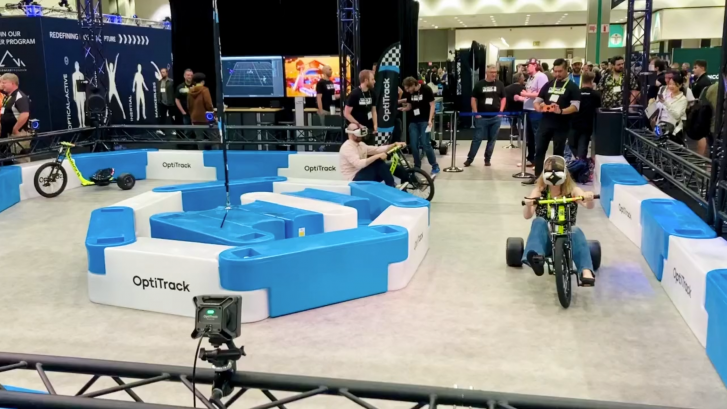
We had an exciting week at the Siggraph 2023 computer graphics conference in Los Angeles showcasing LPVR-AIR! Together with optical tracking systems maker Optitrack and content creator Meptik we developed a real-time racing experience using trikes. On these trikes exhibition attendees were able to race in a small concourse we set up at the exhibition site. Each trike rider we equipped with a Meta Quest virtual reality headset showing a Mario Kart-like track using our LPVR-AIR tracking and real-time streaming solution.
The twist: We attached an Optitrack active marker target to each HMD so we were able to have multiple players move in a globally referenced tracking volume. With LPVR-AIR we don’t render the 3D content on the HMDs themselves, but wirelessly transmit it from specialized rendering PCs. This allows us to display high polygon-count content on the HMDs without exceeding the limited computing power of the standalone headsets.
We are still working on a dedicated product page for LPVR-AIR, but already created a solid amount of documentation how to use the solution. Have a look at it here. The document also gives an insight into the specialities and limitations of the system.
Use-Cases Outside Gaming
LPVR series solutions are the industry standard for large-area VR and AR tracking. They enable consumer and professional headsets to work in conjunction with professional-grade tracking and motion capture systems, leveraging their power both in terms of precision and coverage of large areas. While in this demonstration, the trikes were tracked from the outside, we also enable headset tracking completely contained inside moving platforms such as simulators or cars. We are constantly developing and updating it according to our customers’ needs.
Thanks to everybody who stopped by and pedaled their way around the course. Great riding, well done!