Exploring Affective Computing Concepts

Introduction

Emotional computing isn’t a new field of research. For decades computer scientists have worked on modelling, measuring and actuating human emotion. The goal of doing this accurately and predictively has so far been elusive.

pngwing.com

In the past years we have worked with the company Qualcomm to create intellectual property related to this topic, in the context of health care and the automotive space. Even though this project is pretty off-topic from our ususal focus areas it is an interesting sidetrack that I think is worth posting about.

Affective Computing Concepts

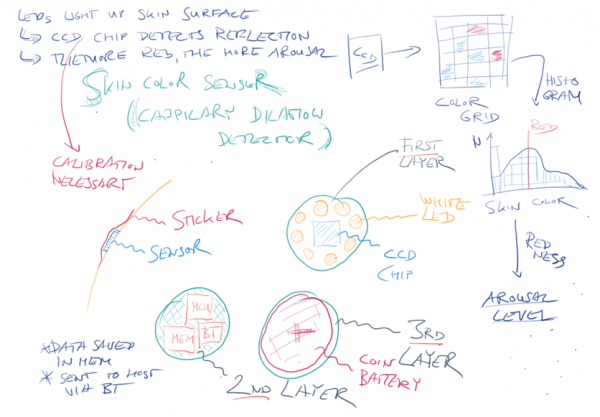
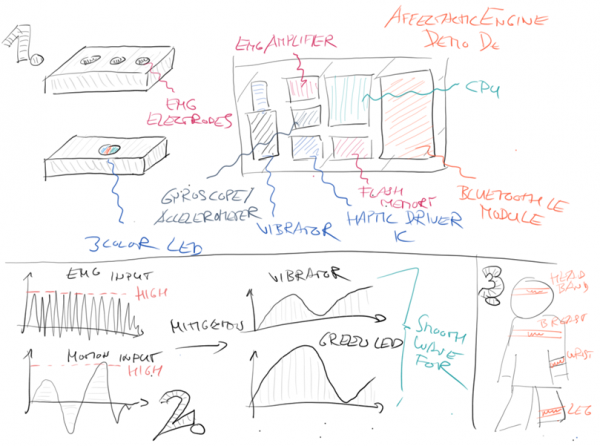
As part of the program we have worked on various ideas ranging from relatively simple sensory devices to complete affective control systems to control the emotional state of a user. Two examples of these approaches to emotional computing are shown below.

The Skin Color Sensor measures the color of the facial complexion of a user, with the goal of estimating aspects of the emotional state of the person from this data. The sensor is to have the shape of a small, unobtrusive patch to be attached to a spot on the forehead of the user.

Another affective computing concept we have worked on is the Affectactic Engine. A little device that measures the emotional state of a user via an electromyography sensor and accelerometer. Simply speaking we are imagining that high muscle tension and certain motion patterns correspond to a stressed emotional state of the user or represent a “twitch” a user might have.

The user is to be reminded of entering this “stressed” emotional state by vibrations emitted from the device. The device is to be attached to the body of the user by a wrist band, with the goal of reminding the user of certain subconscious stress states.

Patents

In the course of this collaboration we created several groundbreaking patents in the area of affective computing:

コネクシオ 設備監視IoTシステムについて

概要

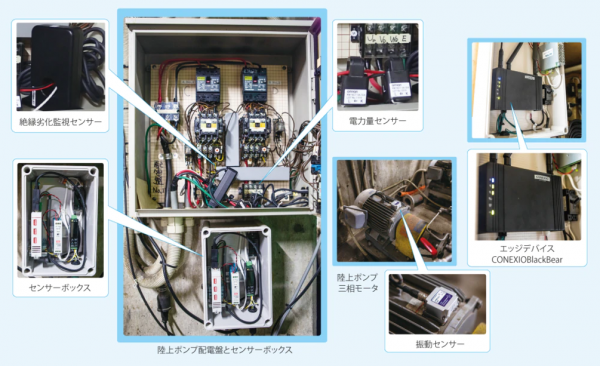
今回はコネクシオ様によって開発された工場等における設備監視IoTシステムについてご紹介します。本システムは工場設備の異常振動等を検知・モニタリングすることで故障予測や設備状況の把握することを目的としています。
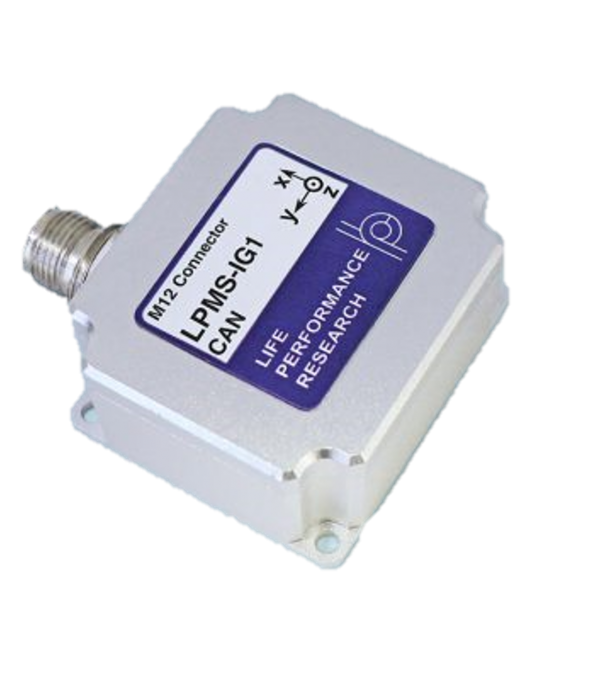
振動を検知するために弊社の製品LPMS-IG1が使用されています。


使用事例:排水処理施設設備の監視

K社では廃水処理プラント施設を運用しています。本施設では有機性の浮遊物や油分が大量に含まれるビルピット汚泥など処理しづらい廃水を「メタン発酵処理」「活性汚泥処理」方法等を組み合わせたシステムにより物理的、生物化学的に分解処理を行っています。

問題

排水処理プラントは365日24時間稼働し続ける必要あります。
また、微生物の働きによって分解を行うため、設備を停止することはできません。そのような状況下において、深夜・早朝休祝日関わらず発生する突発的な故障や緊急対応の業務負荷が大きな課題となっています。

解決

コネクシオ様IoT設備監視システムを実験的に導入。
連続データの見える化により、人的監視では困難な解析や包括的な状態把握が可能となりました。遠隔からポンプの動作状況が確認でき稼働率、時系列での状態変化の把握が可能になった他、現場に行かなくても状態を確認できるため、保守点検・巡回業務の稼働が軽減しました。


実際の機器の写真(※1)


システム構成図(※1)


本システムの詳しい情報については下記のリンクをご参照下さい。

詳細はこちら


本システムにおけるLPMS-IG1

センサーフュージョン機能を搭載した MEMS9 軸 IMU「LPMS-IG1」は弊社製品の中でも最高精度のセンサとなっています。低ノイズ/低ドリフト (4℃/h) の加速度センサに加え、2 種類のジャイロセンサを搭載することにより、幅広い範囲での計測( 400 2000 °/s)が可能です。詳細は製品紹介ページ(日本語)をご確認下さい。

詳細はこちら

耐衝撃性+防水

LPMS-IG1は10,000Gの衝撃を耐える耐久性、IP67の防水機能を有しています。排水プラントのような水に関わる用途や、強い衝撃・振動が発生するケースでも問題なく使用することが可能です。


高いカスタマイズ性

今回のようなケースでは振動検知の精度が求められます。より幅広い数値範囲での振動を検知するため、ローパスフィルタのしきい値設定を変更。故障の予兆となりうる比較的小さな振動も検知できるようになりました。LPMS-IG1は設定ファイルを変更することで簡単にセンサのパラメータを変更することができます。


顧客の問題を解決

LP-Researchのサービスはセンサを販売して終わるわけではありません。
開発を進めていく中でセンサにまつわる様々な問題・不明点等が発生します。弊社ではお客様の問題を解決すべく全力でサポートしております。今回のコネクシオ様の開発においては開発に関する問い合わせ対応はもちろん、システムに必要となったパーツも弊社で開発しました。

開発したパーツ1:複数センサを接続できるCANケーブル


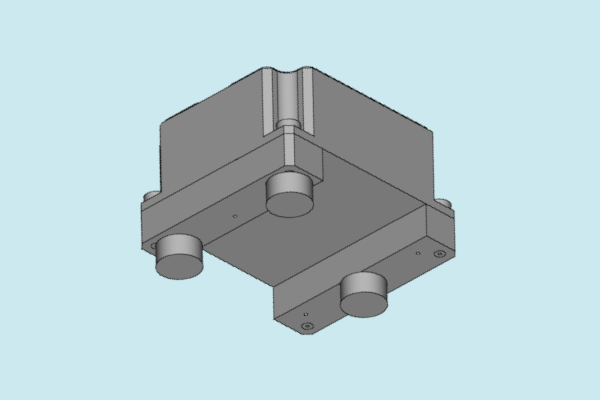
開発したパーツ2:センサをパイプに設置するためのアタッチメント


※1 出典:廃棄物処理施設でのモーター故障検知(K社様)

How to Connect an LP-Research IMU to ROS (Update)

Introduction

This article describes how to connect an LP-RESEARCH inertial measurement unit (IMU) using a Robot Operating System (ROS) node. We are happy to announce that our IMU ROS sensor driver has been accepted into the official ROS package repository. The Robot Operating System, or ROS in short, is an open-source de-facto standard for robotics sensing and control.

With the package openzen_sensor now provided as part of the ROS distribution Melodic Morenia it just became a whole lot easier to use our sensors in robotic applications.

Note: This article covers our node for ROS 1. Please see further information regarding our ROS 2 node at the end of this article. This post is a follow-up to our previous ROS driver release.

Published ROS Topics

These are the ROS topics which are published by the OpenZen ROS driver:

Message

Type

Description

/imu/data

Inertial data from the IMU. Includes calibrated acceleration, calibrated angular rates and orientation. The orientation is always unit quaternion.

/imu/mag

Magnetometer reading from the sensor.

/imu/nav

Global position from a satellite navigation system. Only available if the IMU includes a GNSS chip.

/imu/is_autocalibration_active

Latched topic indicating if the gyro autocalibration feature is active.

Installation of the LPMS ROS Driver

All that’s needed is to install the package openzen_sensor via your Linux distribution’s package manager. In Ubuntu, with the ROS Melodic Morenia distribution installed, use the following command:

Once the IMU ROS driver package is installed, we use the following command to start the OpenZen node:

This will automatically connect to the first available IMU and start streaming its accelerometer, gyroscope and magnetometer data to ROS. If your sensor is equipped with a GPS unit, global positioning information will also be transferred to ROS.

Once a sensor has been connected via the motion sensor driver, the data from the sensor is exported via ROS topics which can be consumed by other ROS components such as a navigation and path planning system.

Outputting IMU sensor values on the command line can now be easily done with:

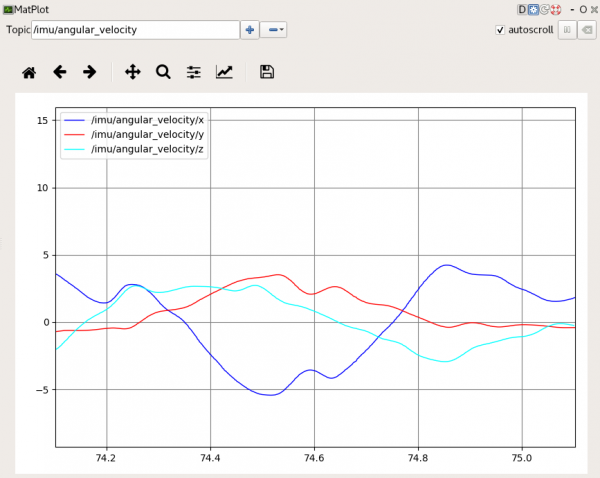
and the data can be plotted with:

More information on the usage of the OpenZen IMU ROS driver can be found in the repository of the driver.

The image above shows an angular velocity output graph in the ROS MatPlot application from an LPMS-IG1 sensor.

ROS 2 Release

We have recently released a ROS 2 version of our OpenZEN ROS node. The node is not part of an official ROS2 release yet, but it works well on the latest release Foxy. For surther information and source code see the OpenZenROS2 repository.

Design of an Efficient CAN-Bus Network with LPMS-IG1

Introduction to Designing an Efficient CAN-Bus Network

This article describes how to design an efficient high speed CAN-bus network with LPMS-IG1. We offer several sensor types with a CAN bus connection. The CAN bus is a popular network standard for applications like automotive, aerospace and industrial automation where connecting a large number of sensor and actuation units with a limited amount of cabling is required.

While creating a CAN bus network is not difficult by itself, there are a few key aspects that an engineer should follow in order to achieve optimum performance.

Efficient CAN-Bus Network Topology

A common mistake when designing a CAN bus network is to use a star topology to connect devices to each other. In this topology the signal from each device is routed to a center piece by connections of similar length. The center piece is connected to the host to acquire and distribute data to the devices of the network.

For reaching the full performance of a CAN bus network, we strongly discourage using this topology. Most CAN bus setups designed in this way will fail to work reliably and at high speed.

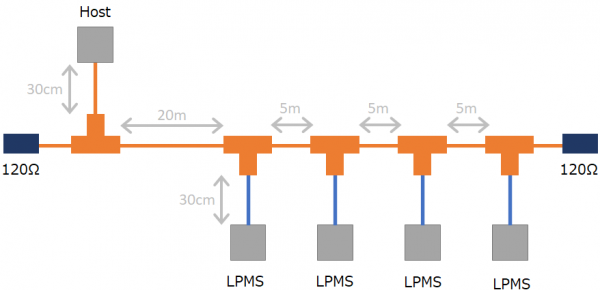
The CAN bus standard’s fundamental concept is to work best in a daisy chain configuration, with one sensor unit or the data acquisition host being the first device in the chain and one device being the last in the network.

Maximum CAN-Bus Speed and Cable Length

A key aspect for the design of an efficient high speed CAN-bus network is to correctly adjust bus cable lengths. The bus line running past each device is to be the longest connection in the network. Each sensor needs to be connected to the bus by a short stub connection. A typical length for such a stub connection is 10-30cm, whereas the main bus line can have a length of hundreds of meters, depending on the desired transmission speed.

Speed in bit/s Maximum Cable Length
1 Mbit/s 20 m
800 kbit/s 40 m
500 kbit/s 100 m
250 kbit/s 250 m
125 kbit/s 500 m

Note that a CAN bus network needs to be terminated using a 120 Ohm resistor at each end. This is especially important for bus length of more than 1-2m and should be considered as general good practice.

LPMS-IG1 CAN-Bus Configuration

One of our products with a CAN bus interface option is our LPMS-IG1 high performance inertial measurement unit. LPMS-IG1 can be flexibly configured to satisfy user requirements. It has the ability to output data using the CANopen standard, freely configurable sequential streaming or our proprietary binary format LP-BUS. These and further parameters can be set via our IG1-Control data acquisition application.

Some CAN bus data loggers that rely on the CANopen standard require users to provide an EDS file to automatically configure each device on the network. While we don’t support the automatic generation of EDS files from our data acquisition applications, depending on the settings in IG1-Control or LPMS-Control, it is possible to manually create an EDS file as described in this tutorial.

In this article we give a few essential insights into how to design an efficient high speed CAN-bus network with LPMS-IG1. If you would like to know more about this topic or have any questions, let us know!

LPVR-DUO Featured at Unity for Industry Japan Conference

Unity for Industry Conference – XRは次のステージへ

LPVR-DUO has been featured at the Unity for Industry online conference in Japan. TOYOTA project manager Koichi Kayano introduced LPVR-DUO with Varjo XR-1 and ART Smarttrack 3 for in-car augmented reality (see the slide above).

Besides explaining the fundamental functional principle of LPVR-DUO inside a moving vehicle – using a fusion of HMD IMU data, vehicle-fixed inertial measurements and outside-in optical tracking information – Mr. Kayano presented videos of content for a potential end-user application:

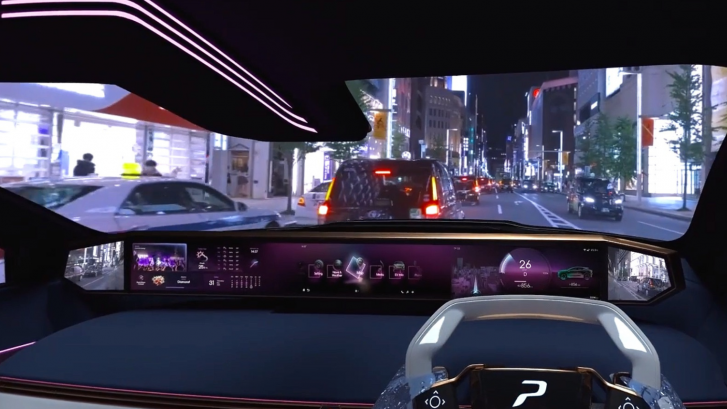
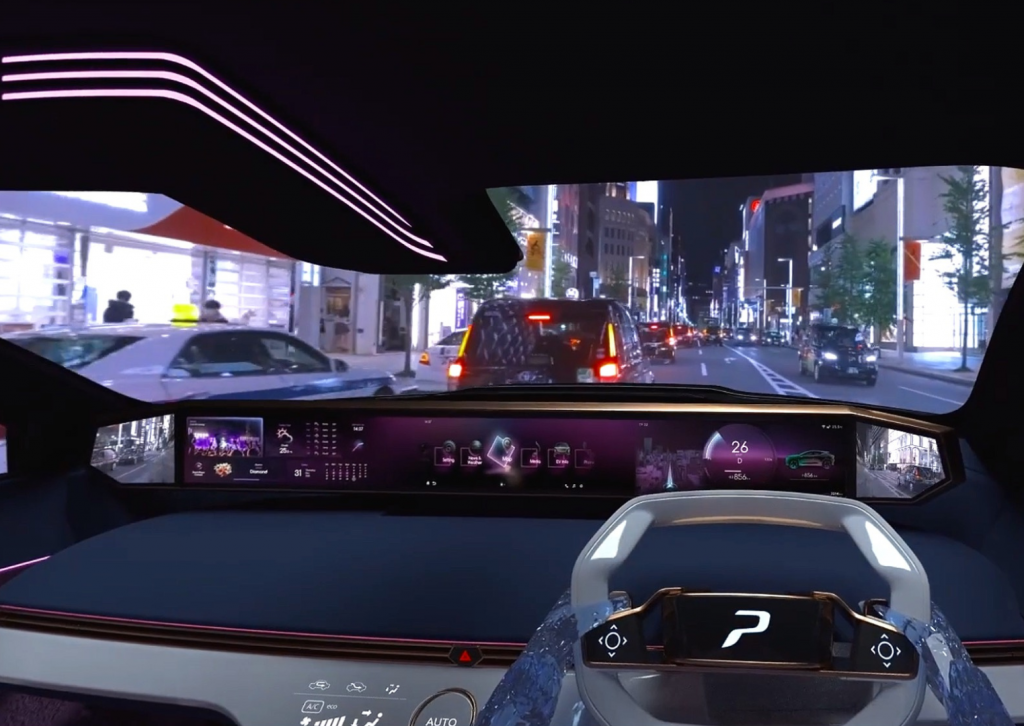
Based on a heads-up display-like visualization, TOYOTA’s implementation shows navigation and speed information to the driver. The images below show two driving situations with a virtual dashboard augmentation overlay.

AR Head-Mounted Display vs. Heads-Up Display

This use-case leads us to a discussions of the differences between an HMD-based visualization solution and a heads-up display (HUD) that is e.g. fixed stationary to the top of a car’s console. While putting on a head mounted display does require a minor additional effort by the driver, there are several advantages of using a wearable device in this scenario.

Content can be displayed at any location in the car, from projecting content onto the dashboard, the middle console, the side windows etc. A heads-up display works only in one specific spot.

As the HMD shows information separately to the left and right eye of the driver, we can display three-dimensional images. This allows for accurate placement of objects in 3D space. The correct positioning within the field of view of the driver is essential for safety relevant data. In case of a hazardous situation detected by a car’s sensor array the driver will know exactly where the danger is occurring from.

These are just two of many aspects that set HMD-based augmented reality apart from a heads-up display. The fact that large corporations like TOYOTA are starting to investigate this specific topic shows that the application of augmented reality in the car will be an important feature for the future of mobility.

NOTE: Image contents courtesy of TOYOTA Motor Corporation.

1 2 3 4 5 15