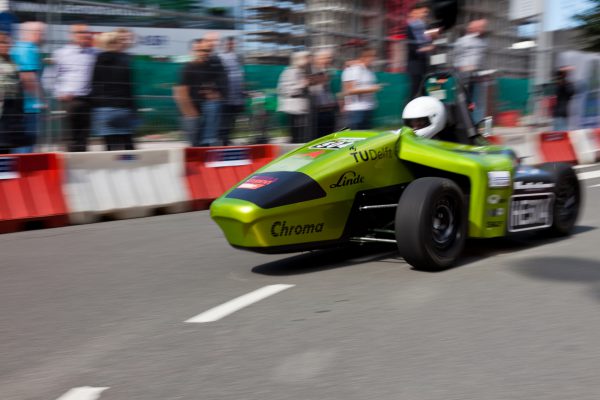
LPMS-CU in ETH Zuerich Formula Student Race Car Flüela
Formula Student Electric Race Car Flüela
Flüela is the fourth four-wheel-driven Formula Student electric race car from the academic motorsports club Zurich. Four self-developed wheel-hub motors with a peak power of 37 kW while weighing only 3.25 kg enable an acceleration from 0-100 km/h in only 1.9s. A lithium polymer accumulator with a capacity of 6.46kWh supplies the car with the needed energy. The self-built carbon fibre monocoque enables a total weight of only 173 kg. Furthermore, the car uses adaptive dampers, which are unique in Formula Student, to adjust the damping forces dynamically to the driving situation. Miscellaneous control algorithms like torque vectoring and traction control ensure the car to deliver its maximum performance at every time of the race.
With Flüela the academic motorsports club Zurich was able to finish two out of four events overall on first place, as well as a second place in Formula Student Germany. The AMZ was able to defend its first place on the world ranking of the Formula Student Electric, and to finish the third year in a row as world champion.
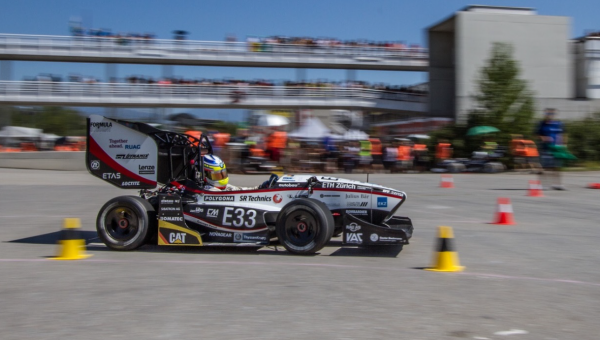
Figure 1 – Flüela in Skidpad at Formula Student Spain.
Implementation of LPMS-CU in Flüela
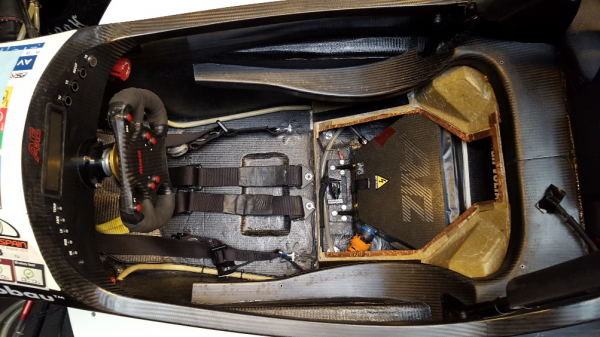
The IMU was implemented in the back of the car. The major decision point of the placement was to set it near to the centre of the gravity of the whole car, including a driver. It was placed under the driver’s seat, next to the accumulator box. Tests were done to see if the high currents next to the accumulator box had any influence on the signal quality coming from the IMU. There were no electromagnetic influences detected. But we were not able to see if the high currents at full torque on the motors or while full recuperation (~200A) and their induced magnetic fields had any negative influence on the measured signals from the IMU. The problem there was that while driving at high speeds, there are further disturbances coming from vibrations of the car.
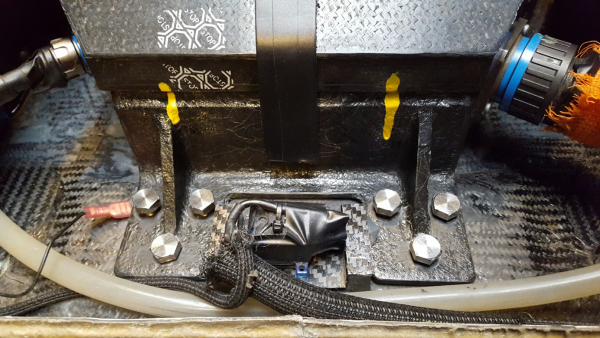
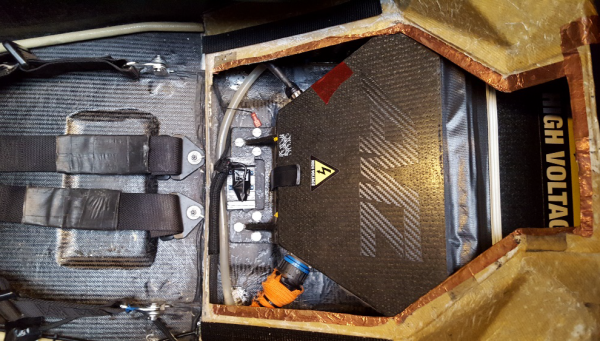
Figure 2 – Installation of LPMS-CU.
Applications of Sensor Data
Vehicle Dynamics Control
The three for our application most important signals coming from the LPMS-CU IMU were the accelerations in x (longitudinal, direction of travel) and y (lateral, direction of the front and rear axle) direction, as well as the rotation rate around the z-axis (vertical direction), further called the yaw rate of the car.
These signals were important inputs for our vehicle dynamics control system. The signal from the IMU has important influences in both, torque vectoring and traction control, as well as several smaller control algorithms used to maximise the performance of the race car.
Furthermore, some points are described, where the signals from the IMU were used in the vehicle dynamics control system:
1. Weight transfer calculation: One important thing to know for calculating the maximum torque which can be used by the tire is the force in z direction at every tire. To calculate this value, we use the accelerations in x and y direction to determine the chassis movement, and to calculate the forces on every single tire.
2. Mu estimator: We are able to adjust the used friction coefficient to calculate the possible deliverable forces of the tires. Depending on the track and the outer conditions, the friction coefficient (mu) is increased or decreased. For this calculations we need the absolute force which is acting on the car in x-direction, which can be calculated by the longitudinal acceleration and the mass of the car.
3. Torque vectoring: The yaw rate is the most important value for our torque vectoring system. By using a simplified vehicle model, we calculate the optimal yaw rate for every corner at every time. This calculated value is then compared to the actual measured value by the IMU, and an occurring error is corrected by an adjusted torque distribution on every wheel.
Data Analysis
Furthermore, the data coming from the IMU was very important for data analysis. One example of the usage of the signals is the G-G-Plot, a classical way to look at the performance of the system car and driver.
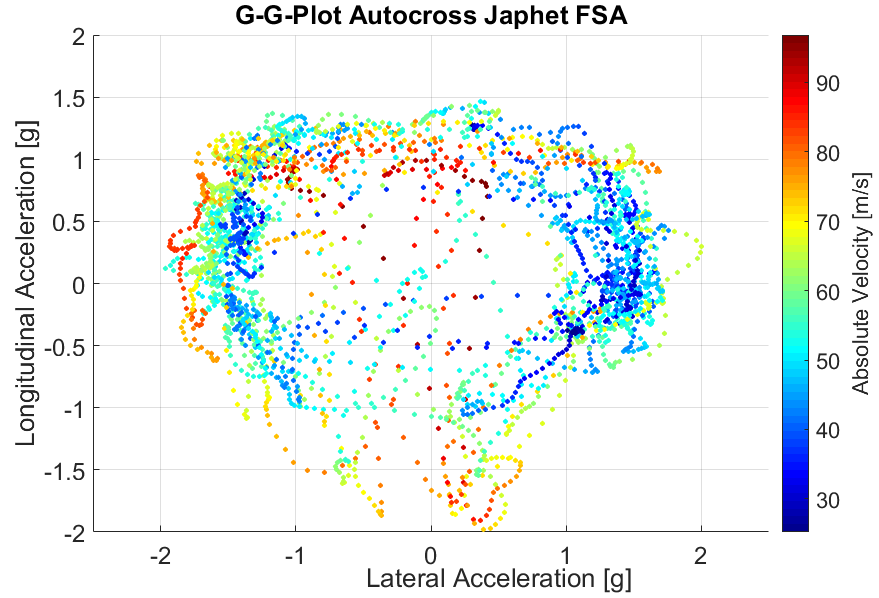
Figure 3 – G-G-Plot of the Autocross event in Austria.
We also used the data from the IMU and the Absolute Speed Sensor (optical measurement of the speed of the car) to approximate the course of the track. These track plots were used to display at which point of the track the accelerations on the car were at a maximum.
In Figure 4 we are able to see at which parts of the track the potential of the car is used, and where higher total accelerations would be possible. In the red parts, the cars potential is used at a maximum, in the blue parts the car-driver system could have performed better.
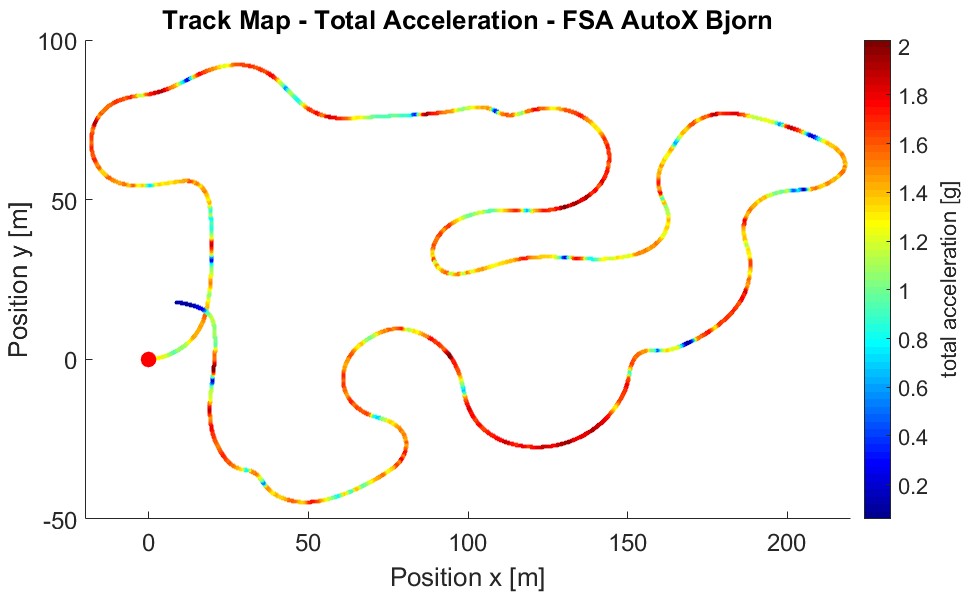
Figure 4 – Track plot Autocross Austria.
Thank you to Formula Student Team Zurich for the detailed report. For further information on the team, please have a look at their website.

