About Klaus Petersen

I like to create magical things, especially projects related to new technologies like augmented and virtual reality, mobile robotics and MEMS-based sensor networks. I code in C(++) and Python, trying to keep up with my very talented colleagues :-)

Design of an Efficient CAN-Bus Network with LPMS-IG1

Introduction to Designing an Efficient CAN-Bus Network

This article describes how to design an efficient high speed CAN-bus network with LPMS-IG1. We offer several sensor types with a CAN bus connection. The CAN bus is a popular network standard for applications like automotive, aerospace and industrial automation where connecting a large number of sensor and actuation units with a limited amount of cabling is required.

While creating a CAN bus network is not difficult by itself, there are a few key aspects that an engineer should follow in order to achieve optimum performance.

Efficient CAN-Bus Network Topology

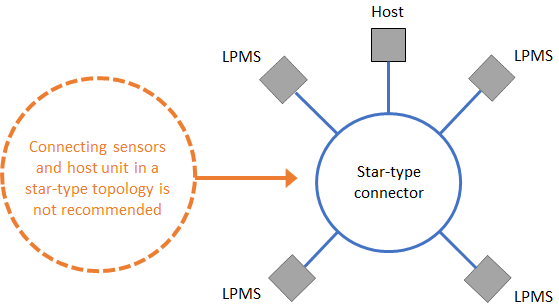
A common mistake when designing a CAN bus network is to use a star topology to connect devices to each other. In this topology the signal from each device is routed to a center piece by connections of similar length. The center piece is connected to the host to acquire and distribute data to the devices of the network.

For reaching the full performance of a CAN bus network, we strongly discourage using this topology. Most CAN bus setups designed in this way will fail to work reliably and at high speed.

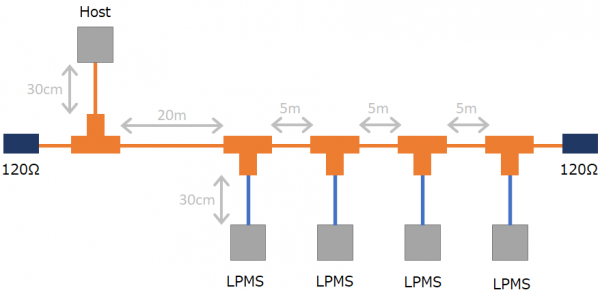
The CAN bus standard’s fundamental concept is to work best in a daisy chain configuration, with one sensor unit or the data acquisition host being the first device in the chain and one device being the last in the network.

Maximum CAN-Bus Speed and Cable Length

A key aspect for the design of an efficient high speed CAN-bus network is to correctly adjust bus cable lengths. The bus line running past each device is to be the longest connection in the network. Each sensor needs to be connected to the bus by a short stub connection. A typical length for such a stub connection is 10-30cm, whereas the main bus line can have a length of hundreds of meters, depending on the desired transmission speed.

Speed in bit/s Maximum Cable Length
1 Mbit/s 20 m
800 kbit/s 40 m
500 kbit/s 100 m
250 kbit/s 250 m
125 kbit/s 500 m

Note that a CAN bus network needs to be terminated using a 120 Ohm resistor at each end. This is especially important for bus length of more than 1-2m and should be considered as general good practice.

LPMS-IG1 CAN-Bus Configuration

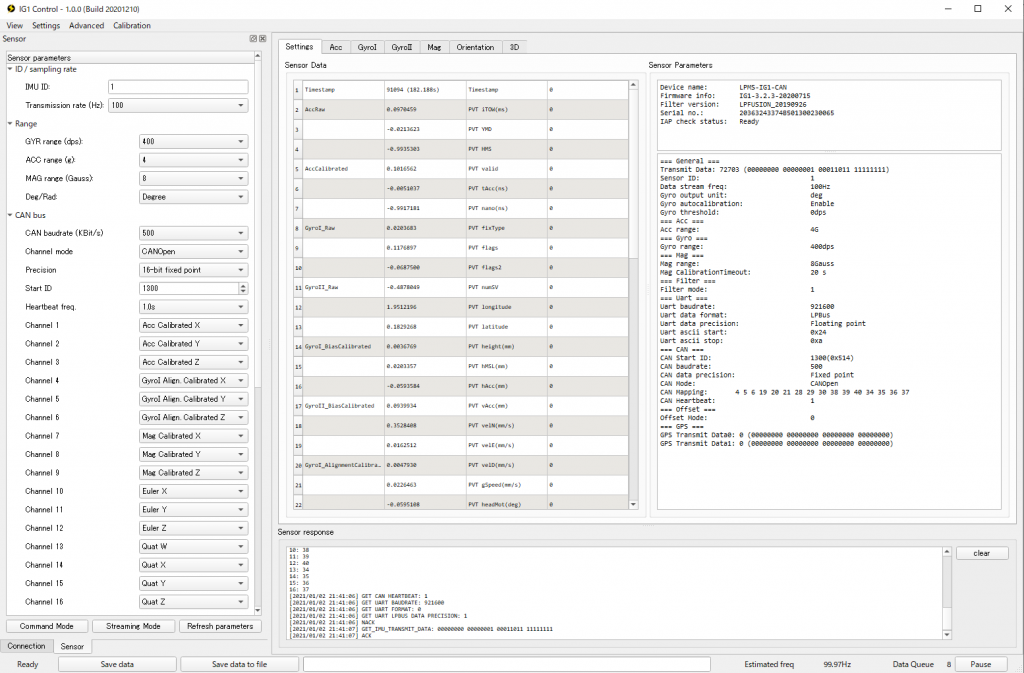
One of our products with a CAN bus interface option is our LPMS-IG1 high performance inertial measurement unit. LPMS-IG1 can be flexibly configured to satisfy user requirements. It has the ability to output data using the CANopen standard, freely configurable sequential streaming or our proprietary binary format LP-BUS. These and further parameters can be set via our IG1-Control data acquisition application.

Some CAN bus data loggers that rely on the CANopen standard require users to provide an EDS file to automatically configure each device on the network. While we don’t support the automatic generation of EDS files from our data acquisition applications, depending on the settings in IG1-Control or LPMS-Control, it is possible to manually create an EDS file as described in this tutorial.

In this article we give a few essential insights into how to design an efficient high speed CAN-bus network with LPMS-IG1. If you would like to know more about this topic or have any questions, let us know!

LPVR-DUO Featured at Unity for Industry Japan Conference

Unity for Industry Conference – XRは次のステージへ

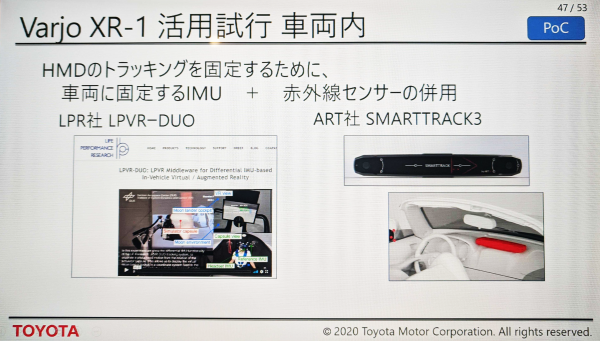
LPVR-DUO has been featured at the Unity for Industry online conference in Japan. TOYOTA project manager Koichi Kayano introduced LPVR-DUO with Varjo XR-1 and ART Smarttrack 3 for in-car augmented reality (see the slide above).

Besides explaining the fundamental functional principle of LPVR-DUO inside a moving vehicle – using a fusion of HMD IMU data, vehicle-fixed inertial measurements and outside-in optical tracking information – Mr. Kayano presented videos of content for a potential end-user application:

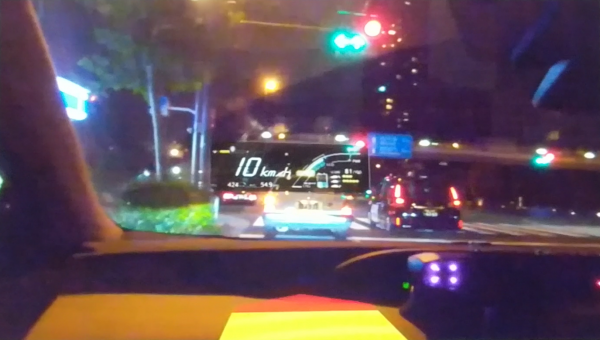
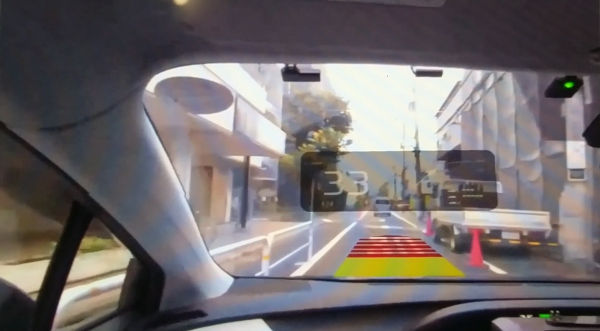
Based on a heads-up display-like visualization, TOYOTA’s implementation shows navigation and speed information to the driver. The images below show two driving situations with a virtual dashboard augmentation overlay.

AR Head-Mounted Display vs. Heads-Up Display

This use-case leads us to a discussions of the differences between an HMD-based visualization solution and a heads-up display (HUD) that is e.g. fixed stationary to the top of a car’s console. While putting on a head mounted display does require a minor additional effort by the driver, there are several advantages of using a wearable device in this scenario.

Content can be displayed at any location in the car, from projecting content onto the dashboard, the middle console, the side windows etc. A heads-up display works only in one specific spot.

As the HMD shows information separately to the left and right eye of the driver, we can display three-dimensional images. This allows for accurate placement of objects in 3D space. The correct positioning within the field of view of the driver is essential for safety relevant data. In case of a hazardous situation detected by a car’s sensor array the driver will know exactly where the danger is occurring from.

These are just two of many aspects that set HMD-based augmented reality apart from a heads-up display. The fact that large corporations like TOYOTA are starting to investigate this specific topic shows that the application of augmented reality in the car will be an important feature for the future of mobility.

NOTE: Image contents courtesy of TOYOTA Motor Corporation.

See-through Display First Look – LPVIZ (Part 3)

Virtual Dashboard Demonstration

This is a follow-up post to the introduction of our in-vehicle AR head mounted display LPVIZ part 1 and part 2.

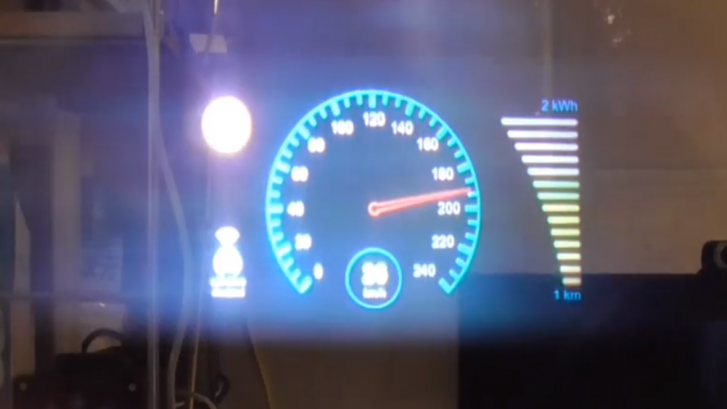
To test LPVIZ we created a simple demo scenario of an automotive virtual dashboard. We created a Unity scene with graphic elements commonly found on a vehicle dashboard. We animated these elements to make the scene look more realistic.

This setup is meant for static testing at our shop. For further experiments inside a moving vehicle we are planning to connect the animated elements directly to car data (speed etc.) communicated over the CAN bus.

The virtual dashboard is only a very simple example to show the basic functionality of LPVIZ. As described in a previous post, many a lot more sophisticated applications can be implemented.

The video above was taken through the right eye optical waveguide display of LPVIZ. We took this photo with a regular smartphone camera and therefore it is not very high quality. Nevertheless, it confirms that the display is working and correctly shows the virtual dashboard.

The user is looking at the object straight ahead. In case the user rotates his head or changes position, his view of the object will change perspectively. An important point to mention is the high luminosity of the display. We took this photo with the interior lighting in our shop turned on normally, and without any additional shade in front of the display.

How to Use LPMS IMUs with LabView

Introduction

LabView by National Instruments (NI) is one of the most popular multi-purpose solutions for measurement and data acquisition tasks. A wide range of hardware components can be connected to a central control application running on a PC. This application contains a full graphical programming language that allows the creation of so called virtual instruments (VI).

Data can be acquired inside a LabView application via a variety of communication interfaces, such as Bluetooth, serial port etc. A LabView driver that can communicate with our LPMS units has been a frequently requested feature from our customers for some time, so that we decided to create this short example to give a general guideline.

A Simple Example

The example shown here specifically works with LPMS-B2, but it is easily customizable to work with other sensors in our product line-up. In order to communicate with LPMS-B2 we use LabView’s built-in Bluetooth access modules. We then parse the incoming data stream to display the measured values.

The source code repository for this example is here.

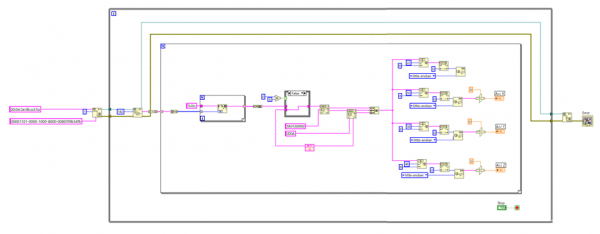
Figure 1 – Overview of a minimal virtual instrument (VI) to acquire data from LPMS-B2

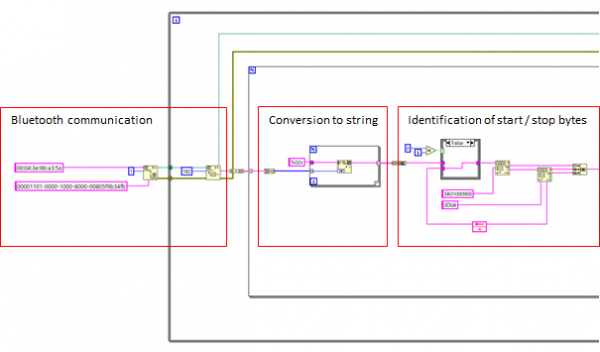
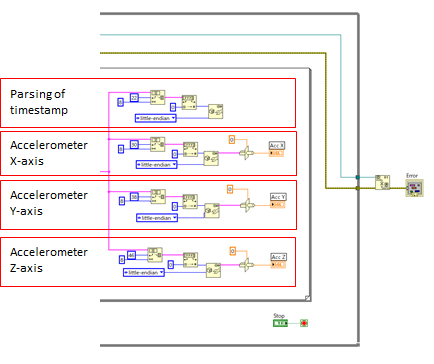
Fig. 1 shows an overview of the example design to acquire the accelerometer X, Y, Z axes of the IMU and displays them on a simple front panel. Fig. 2 & 3 below show the virtual instrument in more detail. After reading out the raw data stream from the Bluetooth interface, this data stream is converted into a string. The string is then evaluated to find the start and stop character sequence. The actual data is finally extracted depending on its position in the data packet.

Figure 2 – Bluetooth access and initial data parsing

Figure 3 – Extraction of timestamp, accelerometer X, Y, Z values

Notes

Please note that the example requires manually entering the Bluetooth ID of the LPMS-B2 in use. The configuration of the data parsing is static. Therefore the output data of the sensor needs to be configured and saved to sensor flash memory in the LPMS-Control application. For reference please check the LPMS manual.

An initial version of this virtual instrument was kindly provided to us by Dr. Patrick Esser, head of the Movement Science Group at Oxford Brooks University, UK.

Collaboration with Pimax

We are happy to announce a collaboration with the head-mounted display (HMD) manufacturer Pimax. Pimax HMDs feature very high resolution (up to 8K pixels) displays and an industry-leading field-of-view (max. 200°). By default, Pimax HMDs support SteamVR tracking and therefore are limited to relatively small tracking volumes.

We developed a special driver that allows our LPVR middleware LPVR-CAD and LPVR-DUO to work with Pimax headsets. Using LPVR, the headsets can now be used within a large-scale, location-based context, in connection with outside-in optical systems such as ART (Advanced Real-Time Tracking).

As Pimax is planning to implement UltraLeap hand tracking in their HMDs in the future, we are confident that we will also be able to extend our inside-out tracking algorithm to their devices.

The video above shows the basic functionality of tracking a Pimax HMD using LPVR and an optical tracking system. The headset’s motions are represented in SteamVR. For this demonstration the tracking volume is relatively small, but can be extended easily by using more outside-in tracking cameras.

This video was kindly provided to us by evoTec Solutions. Evotec is a new company in Switzerland that focuses on virtual reality (VR) solutions for corporations. Contact them for further information!

1 2 3 4 10